Award-Winning Senior Living Care
At The Ohio Masonic Communities, we prioritize customer satisfaction above all else. We understand that choosing a senior living community is a significant decision for senior adults and their families. That’s why we strive to create an environment where senior adults feel valued, engaged, and right at home.
View Browning Masonic Community's Scores View Springfield Masonic Community's Scores View Western Reserve Masonic Community's Scores

Why Customer Satisfaction Matters in Senior Living
Elevating the Quality of Life for Senior Adults
Customer satisfaction at our senior living communities is not just about amenities; it’s about creating a nurturing atmosphere that meets the diverse needs of senior adults. Our commitment to quality ensures that every resident experiences personalized care, enriching activities, and supportive services that enhance their quality of life.
![]()
Achieving Top Quality Senior Living Services
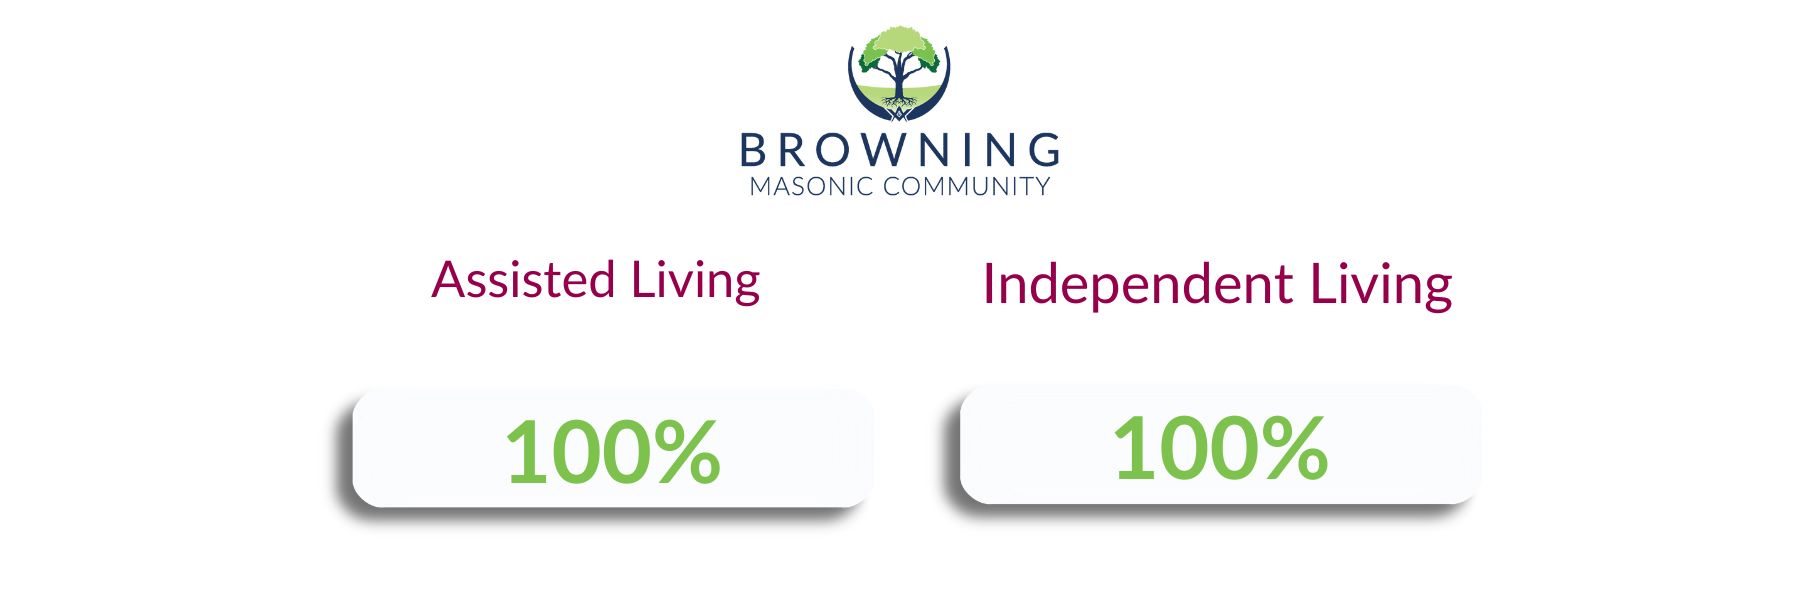
We are proud to share our exceptional Pinnacle Quality Scores, which reflect our dedication to providing the best possible experience for our residents. These scores are derived from direct feedback from our community members and their families, highlighting our strengths in areas such as:
- Personalized Care: Our staff is trained to understand the unique needs of each resident, ensuring tailored support that fosters independence and dignity.
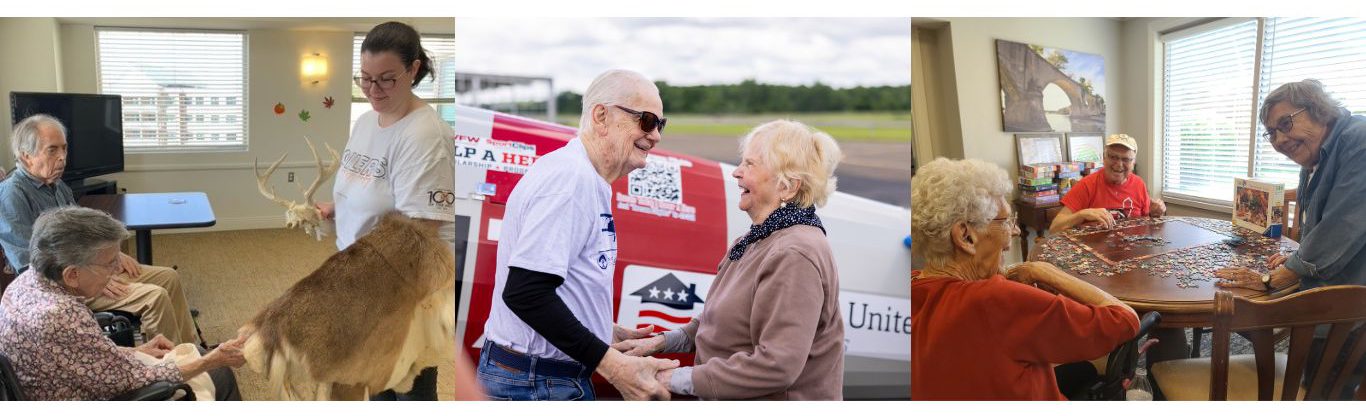
- Engaging Activities: We offer a wide range of programs designed to keep senior adults active and socially engaged, from fitness classes to art workshops to fine dining excursions.
- Safe and Comfortable Living Spaces: Our senior living community is designed with safety in mind, providing a comfortable and secure environment for all residents.
Listening to Our Residents
We believe that the voice of our residents is the most important factor in achieving high customer satisfaction. Regular surveys and feedback sessions allow us to continuously improve our services. We celebrate the positive aspects while also addressing any concerns promptly, ensuring that every senior adult feels heard and valued.
Community and Connection
A vital aspect of our senior living community is the sense of belonging that we foster. We encourage social connections among residents, creating a vibrant atmosphere where friendship and relationships flourish. Our commitment to community engagement directly contributes to higher satisfaction scores and overall well-being among our residents.
Commitment to Excellence
At The Ohio Masonic Communities, our impressive Pinnacle Quality Insight scores are a testament to our unwavering commitment to excellence in senior care. We continuously strive to exceed expectations and maintain the highest standards in our senior living communities.

Nationally Recognized Quality Insights
Nationally recognized, Pinnacle Quality Insight empowers senior care providers to enhance the patient experience through comprehensive surveys that determine overall customer satisfaction.
How It Works
Phone Interviews
We conduct detailed telephone interviews to gather in-depth insights into the satisfaction levels of our community members and their families.
Rating Scale
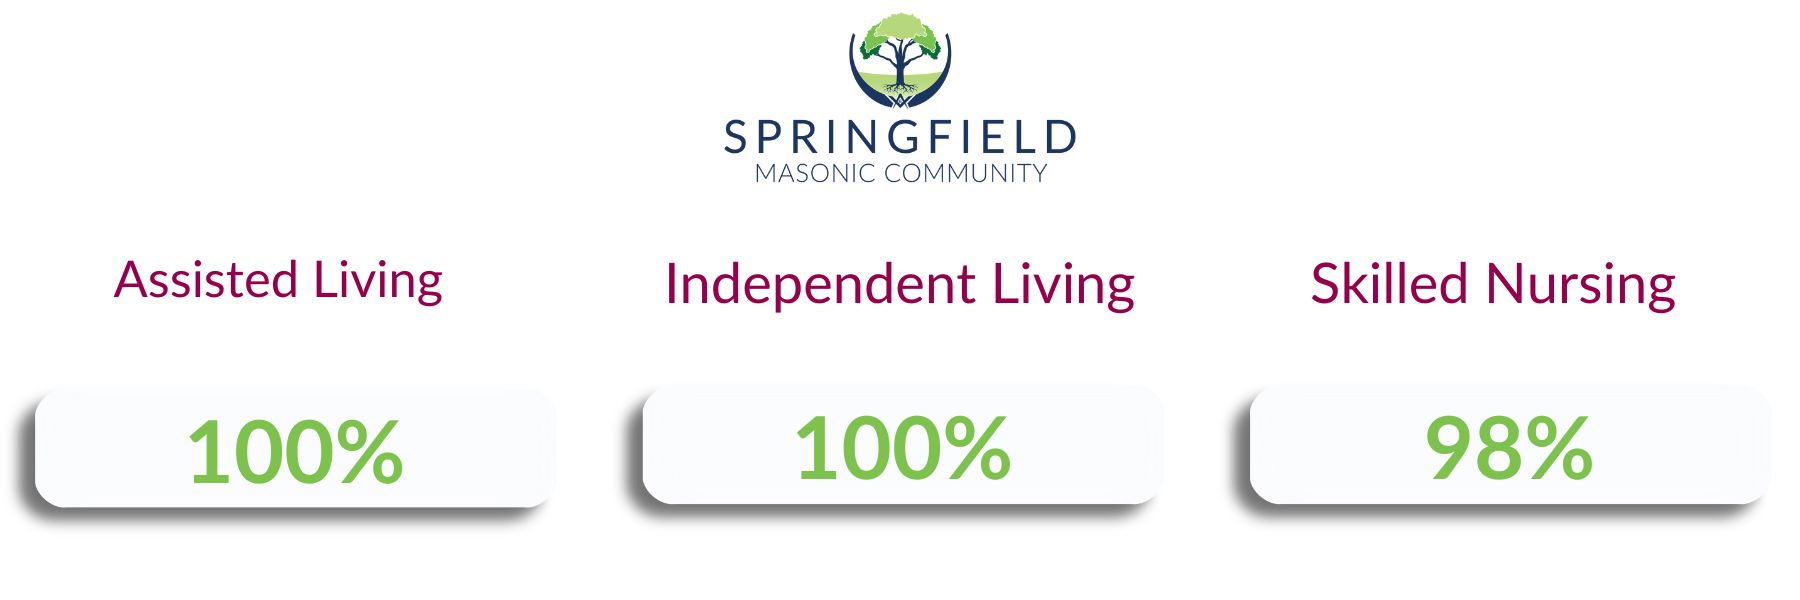
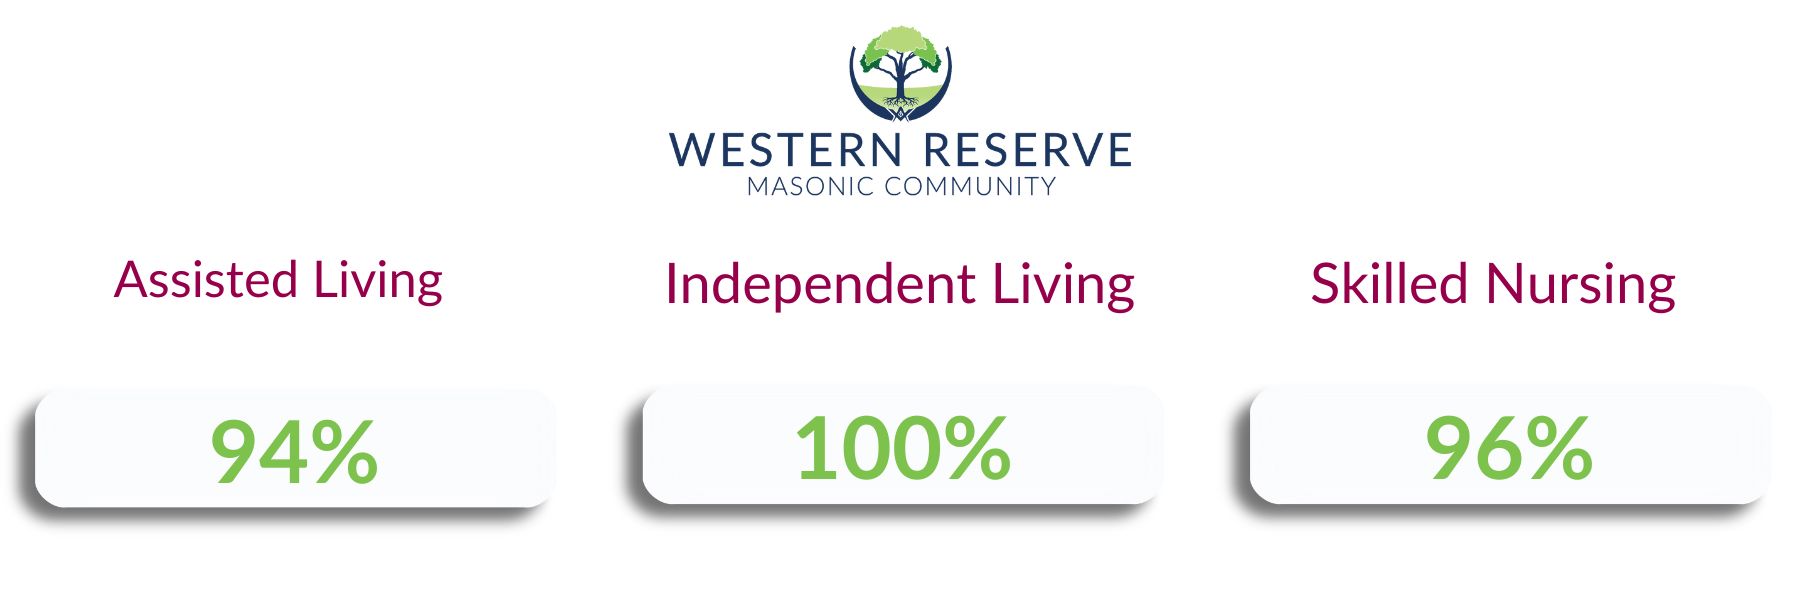
The Pinnacle Quality Insight scoring system ranges from 0 to 5, with percentages reflecting performance in key areas—100% representing the highest level of satisfaction.
Springfield Masonic Community
Western Reserve Masonic Community
Browning Masonic Community